GC / LC — MS High resolution
GC / LC — MS visualization
This tool allows you to visualize and interact with chromatograms generated using GC/LC — MS techniques.
Files loading
This view comes with a preloaded test case, so you may just click on it and start analyzing the data.
It is also designed to work with any file in the JCAMP, NetCDF, or mzData formats. These files can be dragged and dropped or selected by clicking in the same drop module. The files will be displayed in the list below, showing the name of each file.
Chromatogram visualization
When the desired file is clicked, the corresponding chromatogram is displayed, according to the following options:
- Series to work with: visualize and do the peak selection using the total ion chromatogram (tic) or the base peak chromatogram (bpc).
- Lock mass: if there’s any lock mass calibration, it’s possible to introduce the molecular formula or the list of molecular formulas separated by space or commas.
Peak picking in the chromatogram
The results of all selected peaks are stored in the browser, allowing you to safely reload the page and continue working from the current selection. Each peak consists of a retention time, the retention time when it begins, the retention time when it ends, the integral between these values, the relative integral, and the calculated monoisotopic mass. Each peak also has a zoom action that allows you to easily visualize the peak region. These peaks in the plot also have a red rectangle indicating their position and a green line joining the beginning and ending points of the peak.
Automatic peak picking
The automatic peak picking is performed using parameters that filter and improve the results. This peak picking is based on the analysis of the first and second derivatives of the chromatogram; therefore, the beginning of the peak is where there is an inflection point. The parameters are the following:
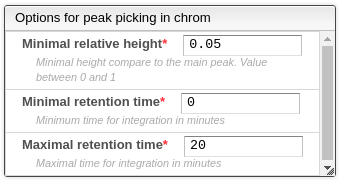
- Minimal relative height: the minimal ratio between the height of the current peak and the highest peak.
- Minimum retention time: the minimal retention time for the integration.
- Maximal retention time: the maximal retention time for integration.
Manual peak picking
All previous peaks can be modified: first select the corresponding line in the list of peaks, then ALT + click once at the beginning of the peak and once at the end of the peak in the chromatogram. This also applies to new peaks. New peaks can be created using the button below the peaks table or by clicking on the plus icon above the table.
Note: automatic peak picking will replace the current peak selection, so it is recommended to use it before manual peak selection.
Peak picking in mass spectra
When a peak in the list of peaks from the chromatogram is selected, the corresponding mass spectrum is displayed. The mass values are selected using the following options:
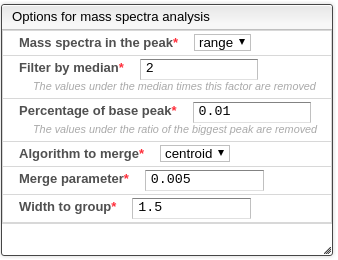
- Mass spectrum in the peak: which part of the peak to use for the mass spectrum. The currently supported options are:
- Range: the spectrum resulting from merging all spectra between the beginning and end of the peak.
- Mean: the mass spectra with a retention time equal to the mean value between the beginning and end of the peak.
- Start: the mass spectra with a retention time equal to the beginning of the peak.
- End: the mass spectra with a retention time equal to the end of the peak.
- Filter by median: the values under the median of the intensities times this parameter are removed.
- Percentage of the base peak: the values under the percentage (between 0-1) of the maximum intensity are removed.
- Algorithm to merge: the algorithm of how to merge two masses and their respective intensities. The current supported algorithms are:
- Centroid: if the distances between the masses is below a parameter, the intensities are added and the mass is weighted to be closer to the most intense original peak.
- Slot: the masses are rounded using a parameter, and if in the rounding step the value is the same the intensities are added.
- Merge parameter: this is the distance parameter used in the previous merge algorithm.
- Width to group: all the values that are at least at this distance in their masses are going to be considered part of the same multiplet.
The current selected monoisotopic mass is selected from the most intense value in the multiplet with the highest mass. This value can be changed doing SHIFT ⇧ + Click over the mass spectra. This will select the closest peak in the mass spectrogram.
Molecular formula prediction
The result of the peak selection on mass spectrometry allows to have an experimental monoisotopic mass that will be matched against a set of possible molecular formulas. This process is controlled by the options:
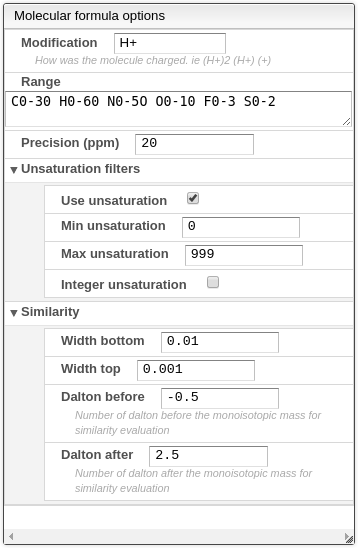
- Modification: how the molecule was charged. Most of the time the value should be H+.
- Range: list of elements followed by their respective range of possible values, separated by a space.
- Precision (ppm): maximum absolute error allowed in ppm. This has a large impact on speed, so be as precise as possible.
- Unsaturation filters:
- Use unsaturation: use unsaturation as a filter method.
- Min unsaturation: minimum allowed value for the saturation.
- Max unsaturation: maximum allowed value for the saturation.
- Integer unsaturation: allows only integer results for the saturation values. This option should not be used when the molecule was charged with a proton.
- Similarity: This will calculate a similarity between the theoretical isotopic distribution and the experimental one. The matching algorithm will consider that each theoretical peak is an isosceles trapezoid with a defined width of the top that should be around the precision of the instrument and the bottom that may be 2 or 3 times the precision. It is expressed in Dalton. You need also to specify the range that will be used to compare the isotopic distribution. For small molecules a value between -0.5 and 2.5 is appropriate. This means that the window compared will be between the monoisotopic mass -0.5 to the monoisotopic mass +2.5.
- Width bottom: width in Dalton of the bottom of the isosceles trapezoid used to match the theoretical spectrum to the experimental spectrum. A good value is 3 times the precision.
- Width top: width in Dalton of the top of the isosceles trapezoid used to match the theoretical spectrum to the experimental spectrum. A good value is half the precision.
- Dalton before: number of Dalton under the monoisotopic mass that define the window used to calculate the similarity between experimental and theoretical isotopic distribution.
- Dalton after: number of Dalton over the monoisotopic mass that define the window used to calculate the similarity between experimental and theoretical isotopic distribution.
These options, combined with the result of the monoisotopic mass, will generate a list of possible molecular formulas. This list shows the molecular formula, the theoretical monoisotopic mass, the unsaturation, and the error in ppm relative to the experimental monoisotopic mass. When a row is clicked, the simulated mass spectrum is overlaid on the mass spectrum of the compound. There is also a zoom action that allows you to zoom into the region where the simulated mass spectrum is located.